The knowledge map
the-knowledge-map

PIPress
Building traceable, high-quality scientific knowledge for AI. From research ideas to trusted publication, accelerating open science and open-source innovation.
3 min read
A feed shows you what happened recently. It is bad at showing you the shape of a field — what connects to what, which areas are dense with solid evidence and which are mostly speculation, who is actually doing the work.
The Knowledge Map is that view. It is public; you do not need an account to look.
 # What it shows
Three things, which together answer "what does this field look like right now?"
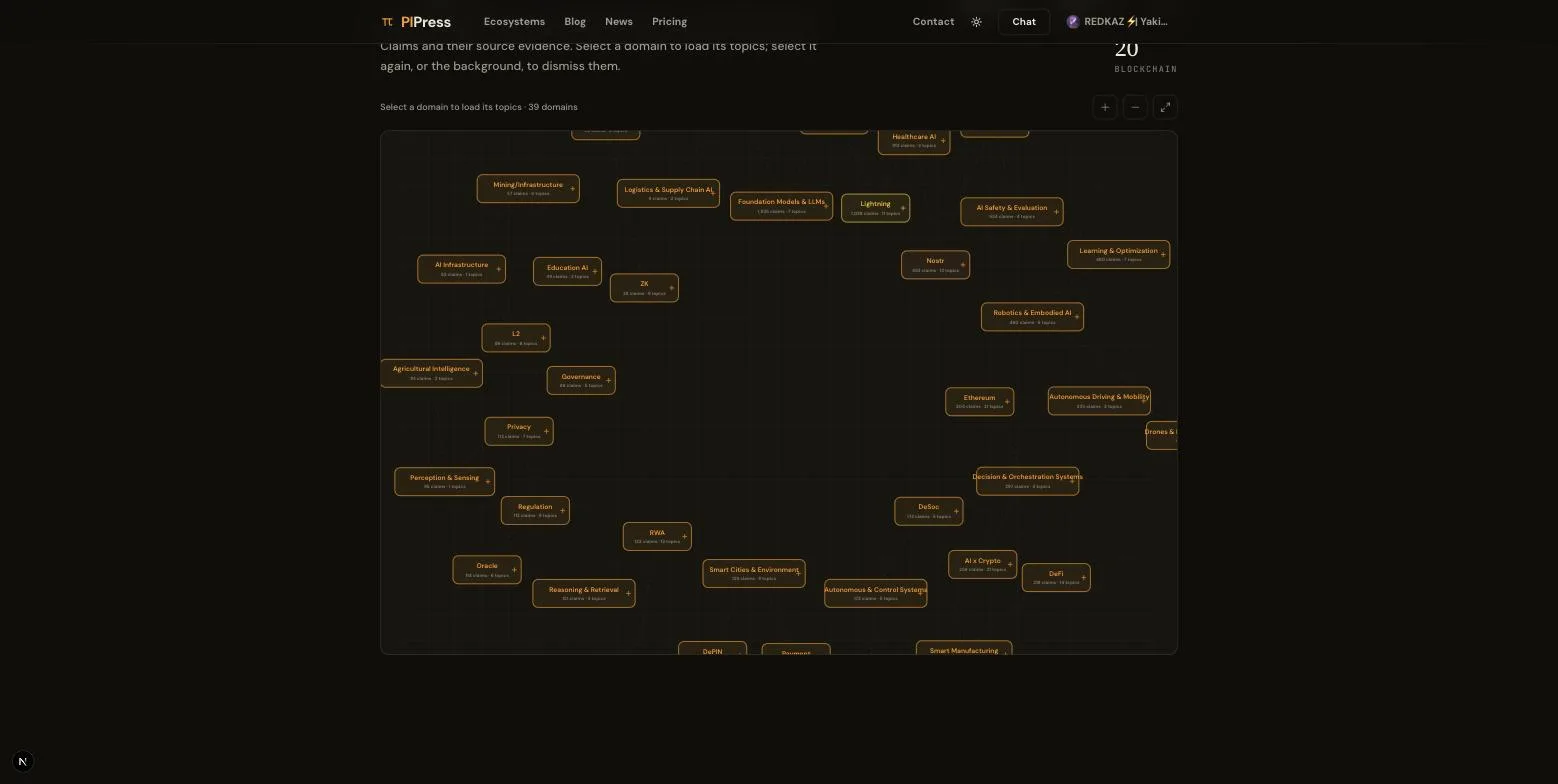
The graph
Claims and how they connect. Findings that reference the same work, the same entities, the same mechanisms end up near each other — so clusters form where a field is active and gaps appear where it is not.
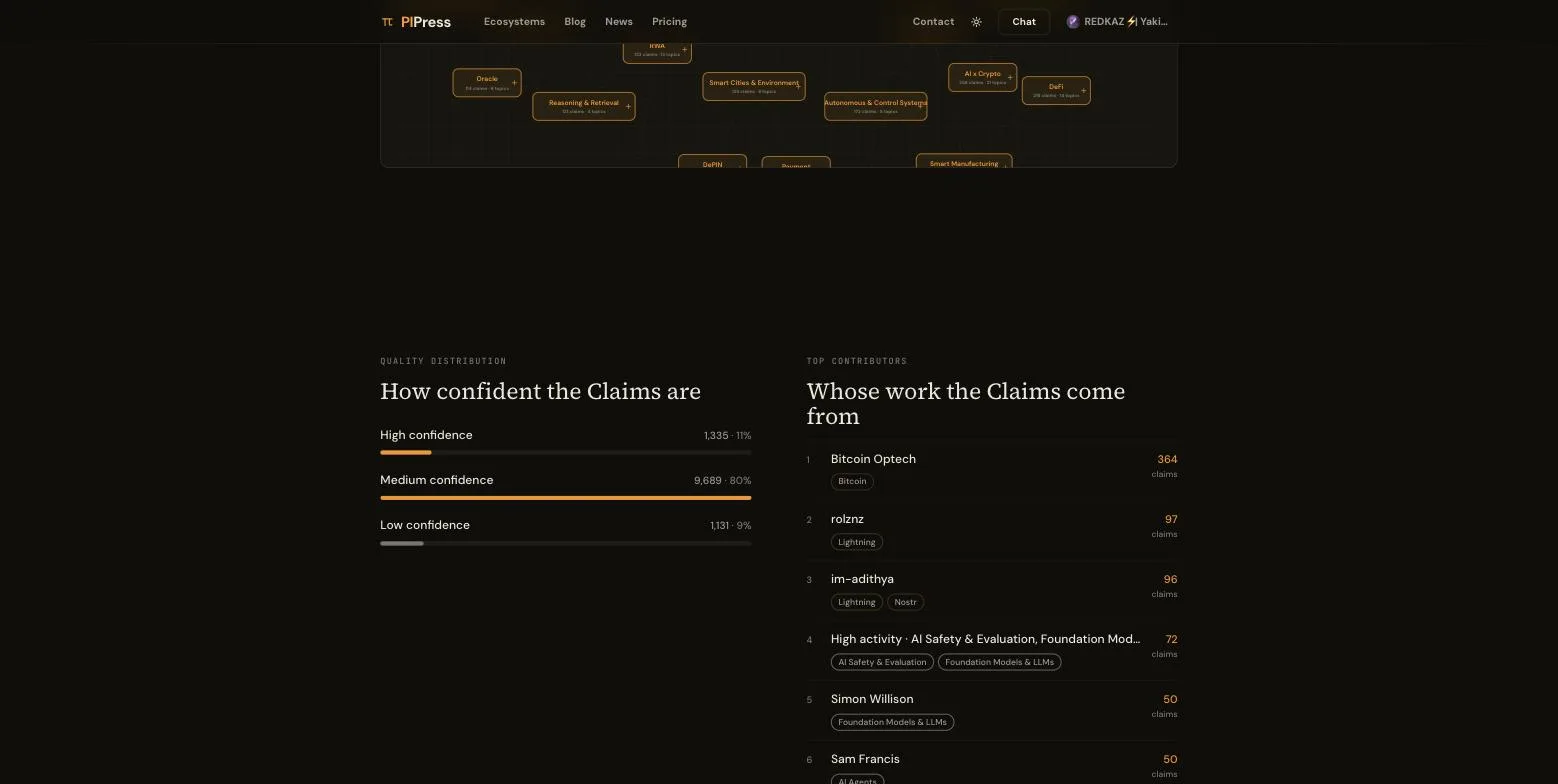
Quality distribution
How the evidence is spread. Some areas are dense with primary sources and ratified standards; others are mostly proposals and preprints. Both are worth knowing, and the difference is rarely visible from reading individual papers.
Top contributors
Who is producing the work, surfaced from the Claims themselves rather than from follower counts.
 ## What it covers today
It currently covers Intelligent Science & Technology — foundational AI, intelligent systems, industrial and physical AI, real-world applications like AI for Science and AI for Education, and blockchain and cryptography.
Structure you can navigate
Claims are filed at four levels of increasing specificity: the broad track, the layer within it, the subdomain, and the precise topic.
That structure is what makes it possible to follow one narrow corner closely without drowning in everything else — and, more interestingly, to notice when two distant corners start pointing at the same thing.
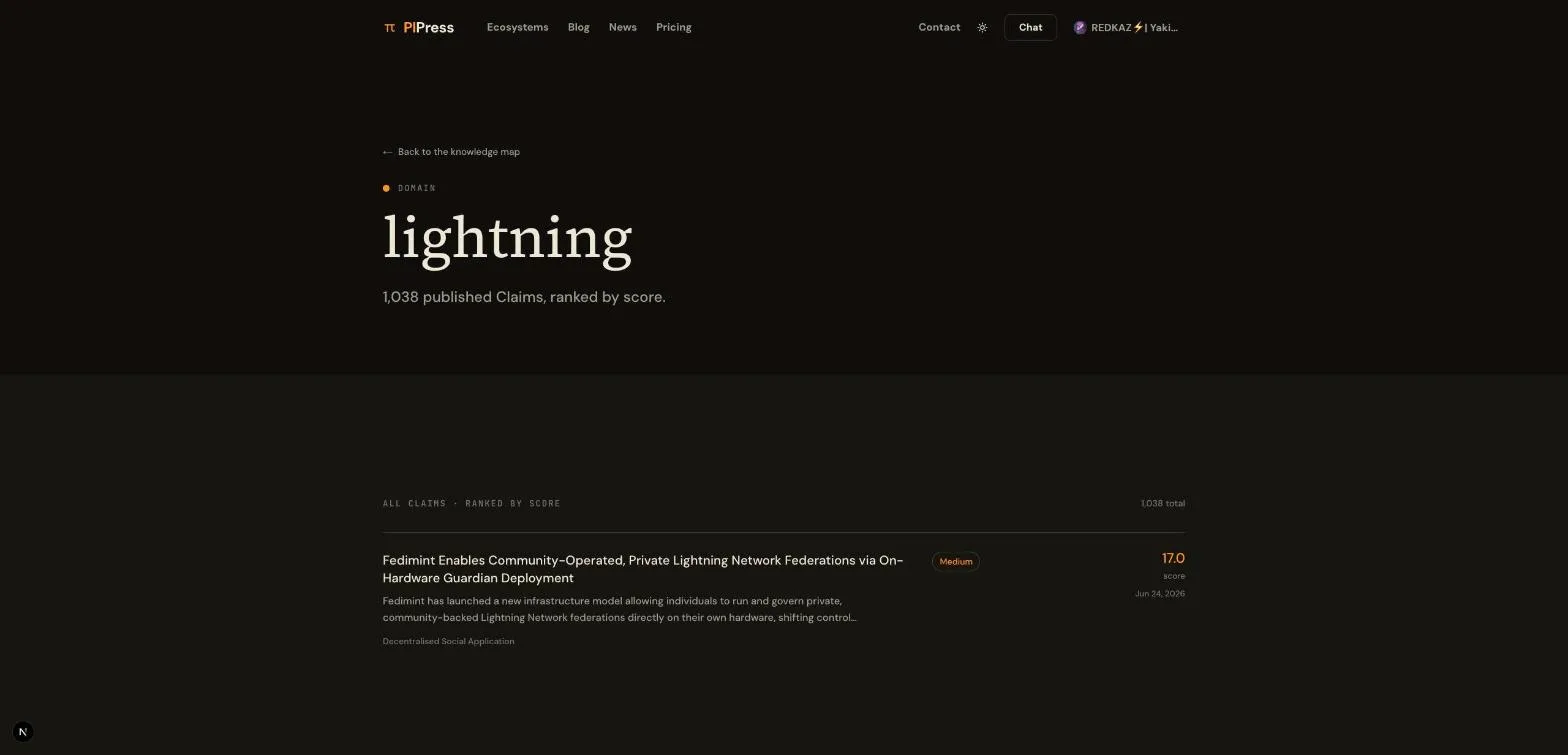
Each domain has its own page with its Claims. Each contributor has one with their work.
 # Why a map rather than a list
A list answers "what is new." A map answers questions a list structurally cannot:
- Where is this field thin on actual evidence?
- Which areas are converging?
- Is there a gap between two active areas that nobody is working in?
That last one is the interesting one. Gaps between well-populated areas are where research opportunities tend to be, and they are close to invisible if you only read sequentially. On a map they are literally visible as empty space.
It is the same data
The map is not a separate dataset or a marketing visualisation. It is the same Claims the feed serves and the same ones published to the open network, arranged spatially instead of chronologically.
So a Claim you find on the map carries everything it carries everywhere else: its evidence, its score, its confidence, its sources.
Have a look
It is public, and the graph loads progressively so you can start exploring before it finishes drawing.
Help keep these ideas circulating
This is an independent project. If you'd like to help support it, you can make a contribution. But there's no obligation at all. Reading, sharing, and coming back is already a form of support.
Read also
1
Summary This regulatory decision marks the formal acceptance of an AI-powered radiological image processing system as a …
2
Four tiers, starting at free. Credits instead of seats, because research is bursty. What carries over, what doesn't, and…
3
A lens is a few standing rules in your own words — the terms you use, the stance you want, the shape of an answer — that…
Want to publish here too? No sign-up, and the text stays yours. Learn how to start
Replies (0)
Loading…